Event Analytics: What Your Photo Engagement Data Reveals
Pixeva Team
Event Analytics: What Your Photo Engagement Data Reveals
You uploaded hundreds (or thousands) of event photos. Guests browsed. Some downloaded. Some searched. Some shared.
But without analytics, you are guessing what worked.
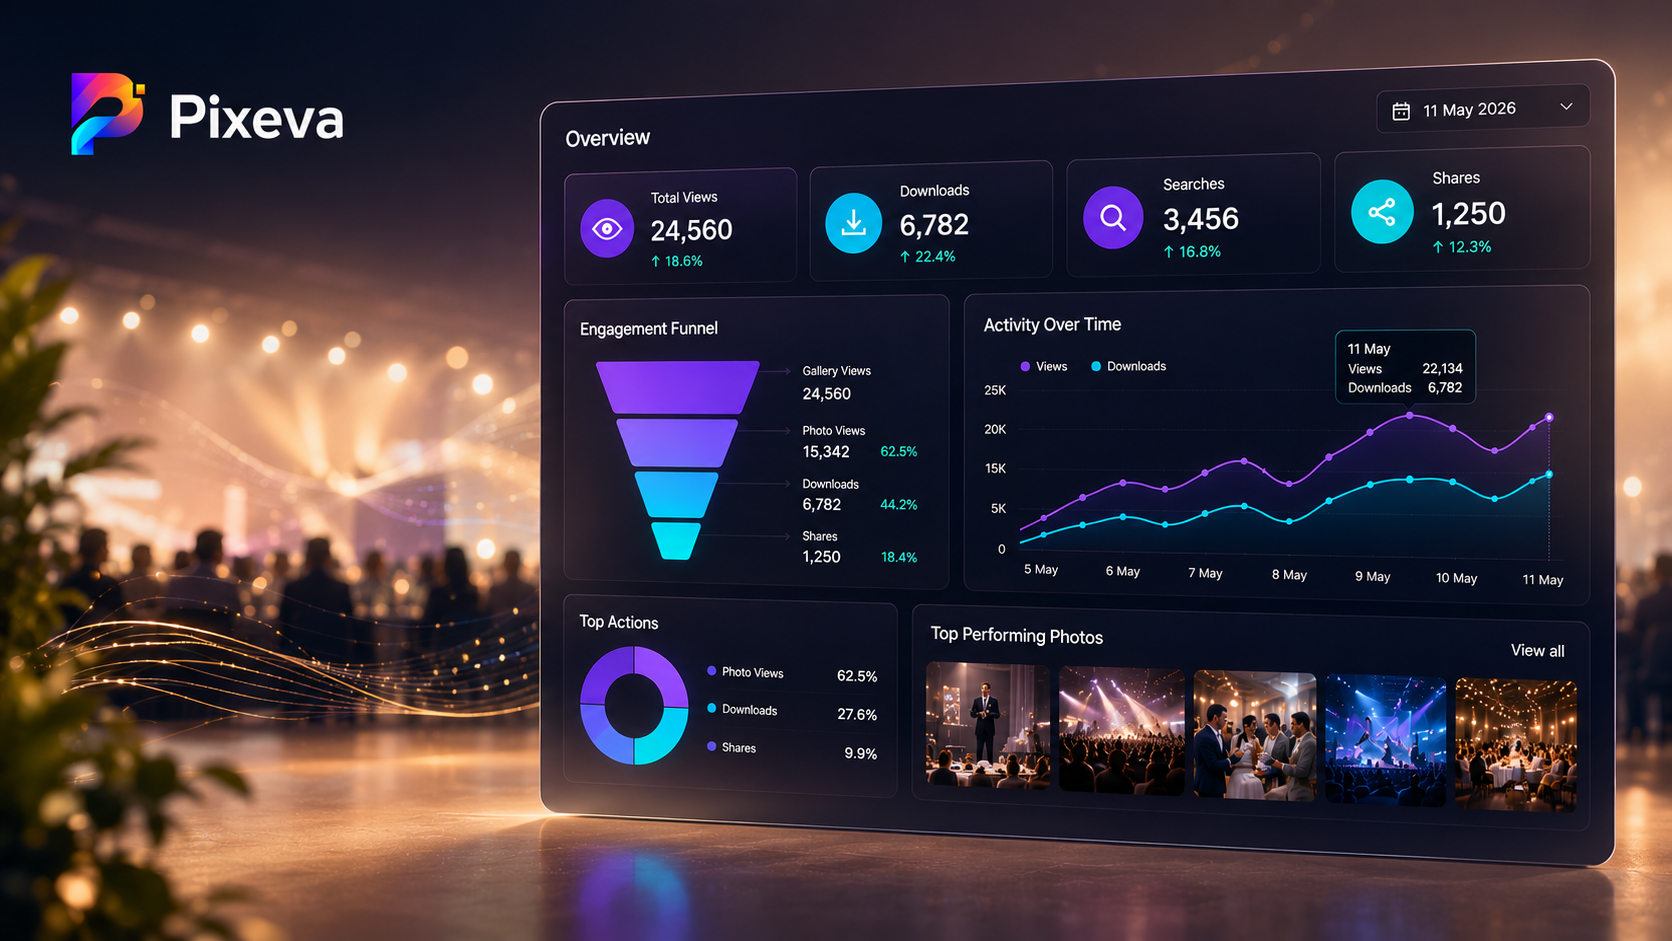
Event photo analytics turns gallery activity into answers: what people cared about, what they skipped, and what to do differently next time. This post explains the metrics that matter, what they reveal about event success, and how photographers, planners, and brands can act on the data.
Why event photo analytics matters
A gallery is not “storage.” It is an experience.
If you only measure uploads, you miss the real story:
- Did guests find themselves quickly?
- Did marketing moments get traction?
- Did downloads spike right after the event—or never?
- Did certain albums or searches outperform others?
Analytics helps you close the loop between delivery and outcomes.
The core metrics (and what they mean)
Different platforms label things slightly differently, but most event galleries track a similar set.
1) Views / opens
What it is: How often photos or the gallery were viewed.
What it reveals:
- Overall interest and reach
- Whether the gallery stayed alive after day one
- Which parts of the event got visual attention (if broken out by album or time)
How to use it:
- If views are low, your distribution (QR, email, signage) may need work—not the photos.
2) Downloads
What it is: How often guests saved photos (single or bulk, depending on settings).
What it reveals:
- Practical value (“I want to keep this”)
- Which moments mattered most to attendees
- Whether permissions and UX made downloading easy
How to use it:
- High views but low downloads can mean friction (permissions, mobile UX, or unclear instructions).
3) Searches (including AI search, if enabled)
What it is: Queries guests run inside the gallery.
What it reveals:
- What language guests use to describe moments
- Which themes repeat (“first dance,” “keynote,” “group photo”)
- Where metadata or organization is weak (lots of vague searches)
How to use it:
- Turn repeated searches into albums, highlights, or pinned collections next time.
4) Engagement funnels (if available)
What it is: Steps from landing → browsing → deep actions (search/download/share).
What it reveals:
- Where guests drop off
- Whether the first screen is compelling enough
- Whether discovery features are discoverable (ironic, but common)
How to use it:
- If guests never reach search, simplify the first screen and add one clear CTA.
5) Time spent / session depth (if available)
What it is: How long people stay and how many photos they interact with.
What it reveals:
- Whether the gallery feels “endless in a bad way” vs “bingeable in a good way”
- Whether highlights are doing their job
How to use it:
- Short sessions + high downloads can be fine (task completed fast).
- Long sessions + low downloads can mean browsing without payoff—tighten highlights.
6) “Top photos” and trending assets (if available)
What it is: Most viewed or most downloaded images.
What it reveals:
- The public “winners” vs photographer favorites (not always the same)
- What should lead social recaps and ads
How to use it:
- Promote top assets in recap decks, newsletters, and sponsor deliverables.
What analytics says about event success (beyond vanity numbers)
Good analytics answers operational questions:
For weddings
- Did family-heavy moments get more attention than the dance floor?
- Did guests download portraits or candids more?
- Did late-night uploads change browsing patterns?
This helps couples and photographers decide what to feature in albums and thank-you comms.
For conferences
- Did keynote visuals outperform breakout candids?
- Did sponsor moments get meaningful views?
- Did downloads cluster around headshots and stage shots?
This helps marketing prove ROI and improve next year’s shot list.
For brands and activations
- Did interactive moments create measurable spikes?
- Did QR-driven entry correlate with higher engagement?
This helps agencies justify creative choices with evidence.
How photographers can use analytics (without becoming data scientists)
Photographers win when analytics supports delivery and upsell:
- Portfolio curation: promote the images guests actually loved
- Package design: emphasize formats that drive downloads
- Client education: show why second shooters and highlight albums matter
- Post-event upsells: “Your top 30 moments” based on real engagement
How planners and organizers should run a monthly “analytics review”
Use a simple 15-minute checklist:
- Top 20 assets — what won?
- Top searches — what did people hunt for?
- Download curve — spike early or late?
- Drop-off — where did sessions end?
- One change for next event — a single improvement beats ten tweaks
Common mistakes when reading analytics
Mistake 1: Treating views as success alone
Views can be inflated by confusion (reloading, hunting). Pair views with downloads, search success, or time depth.
Mistake 2: Ignoring mobile behavior
Events are mobile-first. If analytics show desktop-heavy downloads, you may be pushing people to inconvenient paths.
Mistake 3: Not connecting analytics to distribution
If QR placement was weak, analytics will look “bad” even if photos were great.
Turning insights into action (examples)
-
Insight: “First dance” searches spiked
Action: create a pinned “First dance” album next time -
Insight: downloads clustered in first 48 hours
Action: schedule recap emails while momentum is high -
Insight: keynote photos dominated views
Action: brief photographers earlier about stage angles and sponsor signage visibility
Privacy note (keep trust high)
Analytics should measure gallery behavior, not stalk individuals. Responsible platforms focus on aggregated trends and clear policies. If you write public-facing claims, keep them aligned with your actual product privacy stance and settings.
Conclusion
Event photo analytics is not about charts for charts’ sake. It is about learning what people actually do with your gallery—and using that to deliver better events, faster marketing, and happier guests.
If you are running events on Pixeva, open your analytics dashboard, scan your top metrics, pick one improvement, and ship it for the next event.
Next step: explore your event analytics in Pixeva and turn this week’s gallery into next week’s playbook-(https://pixeva.co)
Keep exploring with Pixeva
Want to put this into practice? These pages go deeper: